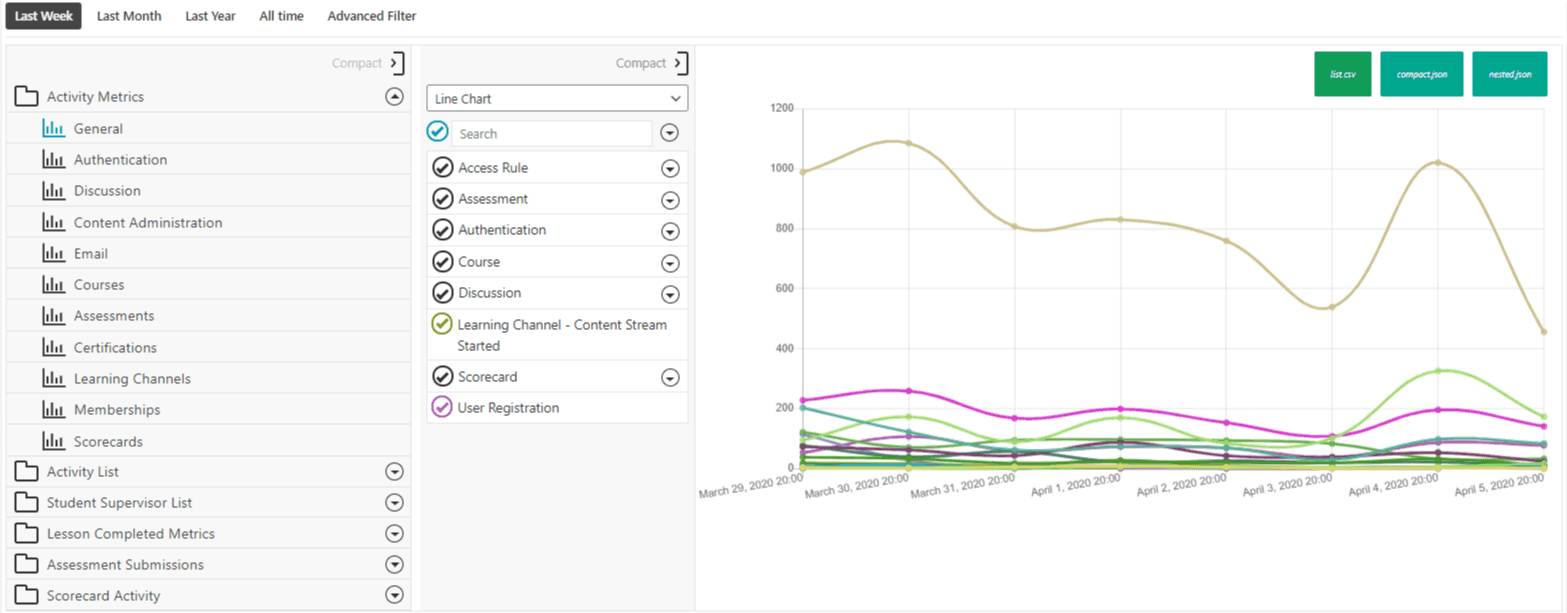
Weekly, Monthly, Yearly 360 Statistics Overview Graph
Overview provides you with a big picture view of all your courses. It is broken down into three tabs:
- Weekly
- Monthly
- Yearly
Keep in mind, you cannot update the data in this view. It shows you data about your users and course activity.
Steps
The following steps will display your Overview.
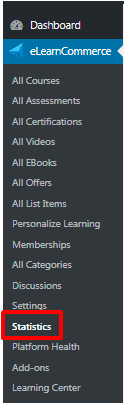
- Go to Statistics on the side menu.
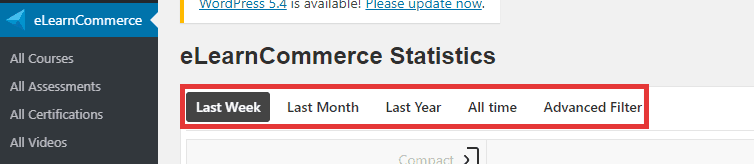
2. Pick Last Week, Last Month or Last Year
3. Click on the tab you wish to review.
1.: Weekly
The Weekly view shows you the progress that has been made over the entire week.
2.: Monthly
The Monthly view shows you the progress that has been made over the year by month.
3.: Yearly
The Yearly view shows you the progress on the course by year.